#53 - Your approval rate metric is lying to you
Last week, a prospect was telling me about their last board meeting. The CFO pulled up a slide showing approval rates across competitor fintechs. Don’t ask me how he got that.
"We're at 83% approval rate while Competitor X is at 91%. That's an 8-point gap costing us millions in lost revenue. When are we fixing this?"
The fraud director shifted uncomfortably. "Well, our fraud rates are half of theirs..."
"I don't care about fraud rates," the CFO interrupted. "I care about approval rates. That's what drives growth."
I've seen this exact conversation play out dozens of times.
And every single time, both sides are arguing about the wrong thing.
Here's why.
The approval rate illusion
Your approval rate tells you one thing: what percentage of payment attempts you accept.
But here's what it doesn't tell you: what percentage of those attempts were fraud to begin with.
If 20% of your incoming payment attempts are fraudulent, you can never achieve higher than 80% approval rate. Not unless you're willing to approve fraud.
It's a mathematical ceiling.
And yet, I consistently meet executives who set approval rate targets without any consideration of their incoming fraud pressure.
"We need to hit 90% approval rates by Q3."
Okay, but what if 15% of your traffic is fraud? You just set an impossible goal that can only be achieved by letting fraud through.
Let's make this concrete
Imagine two fintechs, both processing 10,000 payment attempts per month:
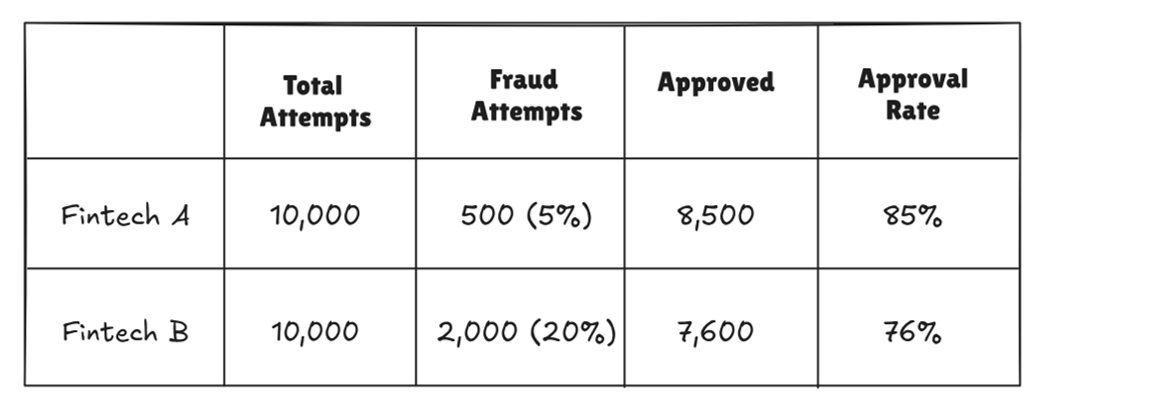
Which fraud team is performing better?
If you're looking at approval rates alone, Fintech A wins decisively.
But here's the thing: Fintech B is facing 4x the fraud pressure and is still approving 95% of their legitimate traffic (7,600 out of 8,000 good attempts).
Fintech A? They're only approving 89% of their legitimate traffic (8,500 out of 9,500 good attempts).
Fintech B's fraud team is actually outperforming Fintech A's. By a lot.
But no one can see it because everyone's obsessing over the wrong metrics.
How to actually measure approval rate
The fix is straightforward: normalize your approval rates by fraud pressure.
Throughout my career we used to call it “Good User Approval Rate”, but I think a better term is Fraud-Adjusted Approval Rate (FAAR). Here's how you calculate it:

Using our example from before:
Fintech A: 8,500 / (10,000 - 500) = 89.5% FAAR
Fintech B: 7,600 / (10,000 - 2,000) = 95.0% FAAR
Now we're seeing the real picture. Fintech B is approving a higher percentage of legitimate customers despite having a lower raw approval rate.
The fraud pressure you're not tracking
Here's where most teams get stuck: "How do I know what percentage of my traffic is fraud?"
You won't know precisely. But you can estimate it well enough to be useful:
Method 1 - Use your AI scores: If your fraud model is remotely decent, look at the distribution of high-risk scores (say, 80+). That population size relative to total traffic gives you a floor estimate of fraud pressure.
Method 2 - Track declined fraud: Add up all the fraud you blocked (declines + manual reviews) plus confirmed fraud that got through (chargebacks, account takeovers, etc.). This gives you a minimum fraud pressure figure.
Method 3 - Segment and extrapolate: You probably have some high-quality labeled data on certain segments. Use those fraud rates as proxies for similar segments where labeling is incomplete.
Method 4 - Leverage Agentic AI: LLMs do quite well at labeling fraud, especially when response times matter less. They would not be accurate all the time, but they can scan your declined population quickly.
Will these be perfect? No. But tracking fraud-adjusted approval rates at 80% accuracy is infinitely better than tracking raw approval rates at 100% accuracy while making terrible decisions.
What this means for your fraud strategy
Once you start tracking fraud pressure alongside approval rates, three things become immediately clear:
First, your fraud team's performance looks very different. That month where approval rates dropped 4 points? Fraud pressure jumped 6 points. Your team actually overperformed.
Second, your vendor evaluations change. Next time a vendor promises to boost approval rates, you can now challenge them more effectively.
Third, your strategic conversations become more honest.
Instead of "Why are our approval rates down?" you can ask "Is this decline in approval rates proportional to the increase in fraud pressure we're seeing?"
Now you're having a conversation about trade-offs, not blame.
The bottom line
Approval rates without context are vanity metrics.
Fraud-adjusted approval rates are reality metrics.
The next time someone in your organization starts benchmarking approval rates, ask them one simple question:
"What's our incoming fraud pressure, and how does it compare to the benchmark?"
If they can't answer, you're comparing apples to oranges.
How are you tracking fraud pressure at your organization? Or are you still flying blind on approval rates? Hit reply and let me know—I read every response.
In the meantime, that’s all for this week.
See you next Saturday.
P.S. If you feel like you're running out of time and need some expert advice with getting your fraud strategy on track, here's how I can help you:
Free Discovery Call - Unsure where to start or have a specific need? Schedule a 15-min call with me to assess if and how I can be of value.
Schedule a Discovery Call Now »
Consultation Call - Need expert advice on fraud? Meet with me for a 1-hour consultation call to gain the clarity you need. Guaranteed.
Book a Consultation Call Now »
Fraud Strategy Action Plan - Is your Fintech struggling with balancing fraud prevention and growth? Are you thinking about adding new fraud vendors or even offering your own fraud product? Sign up for this 2-week program to get your tailored, high-ROI fraud strategy action plan so that you know exactly what to do next.
Sign-up Now »
Enjoyed this and want to read more? Sign up to my newsletter to get fresh, practical insights weekly!